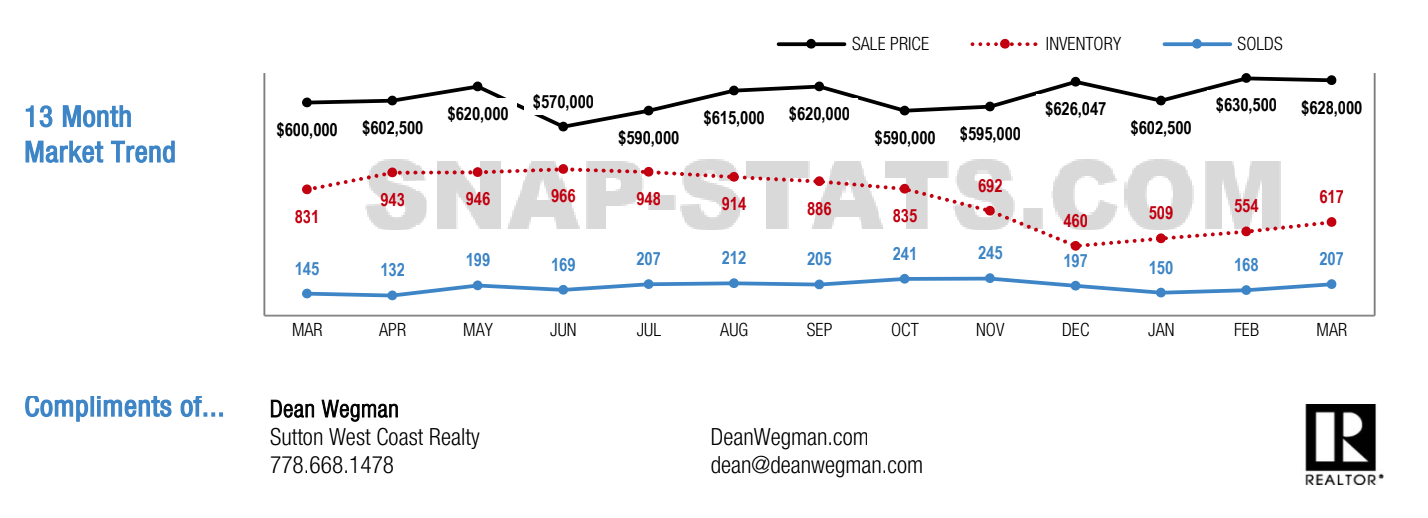
In March the Burnaby Mountain SFU condo and townhouse real estate market tipped into to a low “Seller’s” market from an upper “Balanced” market in February.
Home buyer demand at the beginning of the month was quite high across Greater Vancouver with sharply priced condos and houses often selling in competition and over asking price.
Since the COVID 19 pandemic conditions intensified mid March a majority of people have now put their home search’s on pause except for those with urgent housing needs. This current levelling off in demand and reduction in sales will bring a return to more balanced conditions in the short term, and potentially a future buyer’s market if prolonged into summer.
How do we know we’re in a Seller market? List to Sales Ratio
A buyer’s market has a 0-12% list to sales ratio
A balanced market has a 12-20% list to sales ratio
A seller’s market has a 21% or greater list to sales ratio
For Burnaby Mountain SFU the overall list to sales ratio was 23% (previously 22%), with 44 listings and 10 sales in March.
Generally, analysts say that downward pressure on home prices occurs when the ratio dips below the 12 per cent mark for a sustained period, while home prices often experience upward pressure when it surpasses 20 per cent over several months.
The BIGGER picture
Here’s the breakdown for condos and town homes in the city of Burnaby in March:

When comparing March to February Burnaby condo & townhome inventory increased by 11%, total sales increased by 23%, and benchmark prices were flat at 0%.
Any Q's or more specific information needed on a particular neighbourhood please contact us
All stats derived from Dean Wegman & SnapStats.
Home buyer demand at the beginning of the month was quite high across Greater Vancouver with sharply priced condos and houses often selling in competition and over asking price.
Since the COVID 19 pandemic conditions intensified mid March a majority of people have now put their home search’s on pause except for those with urgent housing needs. This current levelling off in demand and reduction in sales will bring a return to more balanced conditions in the short term, and potentially a future buyer’s market if prolonged into summer.
How do we know we’re in a Seller market? List to Sales Ratio
A buyer’s market has a 0-12% list to sales ratio
A balanced market has a 12-20% list to sales ratio
A seller’s market has a 21% or greater list to sales ratio
For Burnaby Mountain SFU the overall list to sales ratio was 23% (previously 22%), with 44 listings and 10 sales in March.
Generally, analysts say that downward pressure on home prices occurs when the ratio dips below the 12 per cent mark for a sustained period, while home prices often experience upward pressure when it surpasses 20 per cent over several months.
The BIGGER picture
Here’s the breakdown for condos and town homes in the city of Burnaby in March:

- Overall a “Seller’s” market with a 34% list to sales ratio (up from 30% in Feb) with an average 3.4 in 10 selling rate
- The most active price range was for homes between $600K to $700K with an average 44% list to sales ratio
- Condos & townhomes are selling on average 2% below list price.
- Buyer’s Best Bet: Homes between $1M to $1.25M, Central, Oaklands, Sullivan Heights and minimum 4 bedroom properties
- Seller’s Best Bet: Selling Homes in Cariboo, Government Road, South Slope and up to 1 bedroom properties.
When comparing March to February Burnaby condo & townhome inventory increased by 11%, total sales increased by 23%, and benchmark prices were flat at 0%.
Any Q's or more specific information needed on a particular neighbourhood please contact us
All stats derived from Dean Wegman & SnapStats.